

Here we meet again fellows! As you may have noticed that two months ago I published what I genuinely thought was my best video yet — strong hook, clean edit, good thumbnail. The first 48 hours? 312 views. I sat there refreshing the dashboard like that would somehow change things, then spent an embarrassing amount of time in a rabbit hole of YouTube analytics guides trying to figure out what I’d done wrong.
Here’s what I eventually learned: I was looking at the wrong numbers entirely. And honestly, so are most creators I talk to. This is a guide to the metrics that actually predict growth — and the tools that help you act on them.
Why Most Creators Look at the Wrong YouTube Metrics
The first thing most of us open in YouTube Studio is the view count. Then maybe the subscriber gains. Both feel satisfying when they’re up, devastating when they’re not — and neither one tells you why a video is performing the way it is.
Raw views are an outcome, not a lever. You can’t pull on “views” to get more views. What you can pull on are the upstream signals that cause YouTube to recommend your content in the first place: whether people click when they see your thumbnail, and whether they stick around once they do.
Daily subscriber count — watching it change by single digits every day — is emotionally exhausting and strategically useless. Engagement rate, calculated as a ratio of interactions to views, matters far more than raw comment or like counts.
The creators I’ve watched plateau for years are almost always obsessing over vanity metrics. The ones who break through are the ones who learned to diagnose why a video is or isn’t getting recommended.

The Metrics That Actually Predict Channel Growth
CTR, AVD, Re-watches — What Each Tells You
There are three metrics worth understanding deeply before you touch any third-party tool.
Click-Through Rate (CTR) is the percentage of people who clicked your video after YouTube showed it to them. The platform-wide average sits around 4% to 5% for most creators this year. That’s a normal level — it doesn’t mean your thumbnails are fundamentally broken, but it doesn’t mean you should settle there either. Context matters enormously here: a 4% CTR from browse features means something completely different from a 4% CTR from search results. If your overall channel CTR is 5% but your search CTR is 12% and your browse CTR is 2%, you don’t have a CTR problem — you have a browse packaging problem. The aggregated number hides the diagnosis.
Average View Duration (AVD) is total watch time divided by total views — but on its own, it strips away context. A 3-minute AVD on a 4-minute video is excellent. A 3-minute AVD on a 40-minute documentary means you lost almost everyone. What you actually want to look at alongside AVD is the percentage-based retention graph in YouTube Studio — that’s where you find the specific moments where viewers are leaving, and that’s what’s fixable.
Re-watches and audience retention spikes are signals most creators completely ignore. A bump in the retention curve means people scrubbed back to re-watch something. That’s your most engaging moment. A cliff is your biggest problem. Both deserve attention.
Here’s a quick reference for benchmarks as of Q1 this year:
| Metric | Below Average | Average | Strong | Excellent |
| CTR (Browse) | <2% | 3–5% | 5–7% | 7%+ |
| CTR (Search) | <6% | 8–10% | 10–12% | 12%+ |
| AVD retention % | <30% | 35–45% | 45–55% | 55%+ |
| Engagement rate | <1% | 2–4% | 4–6% | 6%+ |
The Best YouTube Video Analysis Tools
Native Analytics vs Third-Party Tools — When to Use Each
YouTube Studio is your non-negotiable baseline. It’s free, it has the most accurate data (because it is the data), and for most diagnostic work — finding where retention drops, which traffic sources drive views, how CTR varies by placement — it’s genuinely sufficient.
YouTube Studio provides the most accurate, comprehensive data including watch time, CTR, audience retention, traffic sources, and revenue. All paid tools supplement YouTube Studio rather than replacing it.
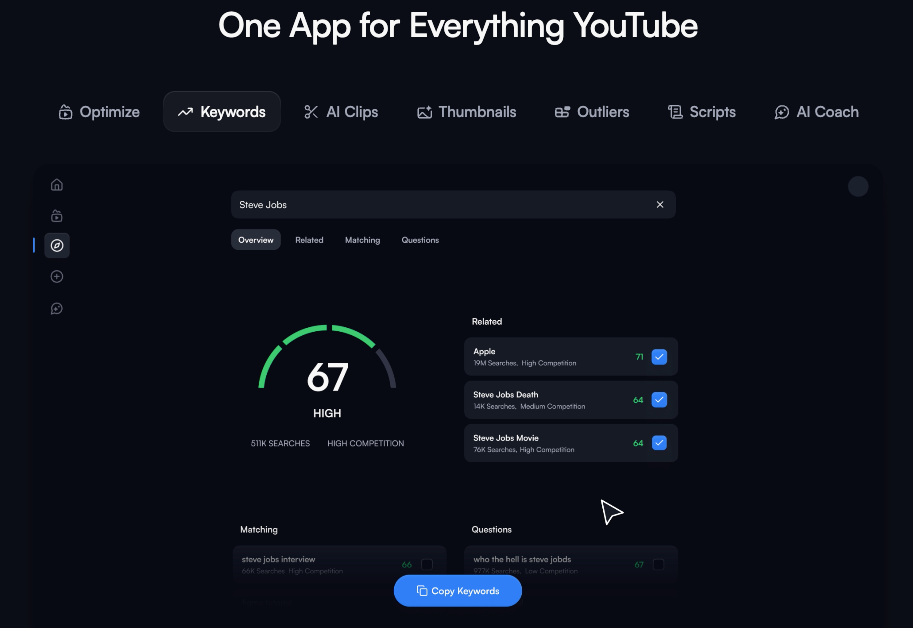
Where third-party tools earn their cost is in three scenarios: competitive intelligence (what are other channels in your niche doing?), A/B testing infrastructure (testing thumbnails and titles systematically), and keyword research (finding topics you can actually rank for before you create).
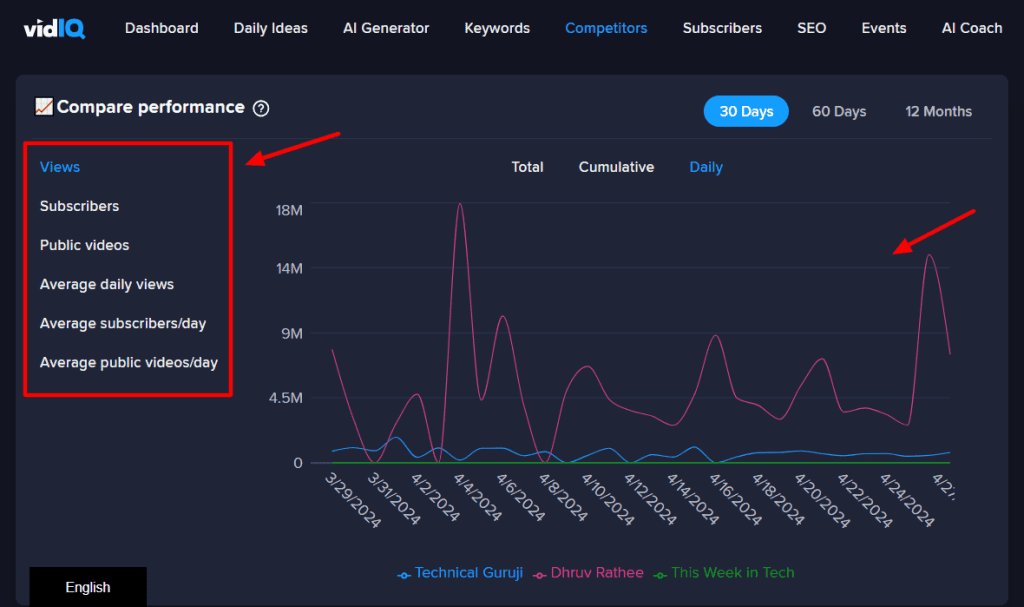
VidIQ is stronger for keyword research, SEO scoring, and competitor tracking — best for search-driven channels. TubeBuddy is stronger for A/B testing, bulk optimization, and workflow management — best for channels with 20+ videos.
Tool stack by channel stage:
| Channel Stage | Recommended Stack | Approx. Monthly Cost |
| 0–1K subs | YouTube Studio only | Free |
| 1K–10K subs | YouTube Studio + VidIQ free tier | Free–$7.50/mo |
| 10K–100K subs | YouTube Studio + TubeBuddy Pro + VidIQ | $17–$25/mo |
| 100K+ subs | Above + ThumbnailTest or OutlierKit | $40–$60/mo |
TubeBuddy’s A/B testing feature allows creators to test two different thumbnails or titles for the same video and automatically select the winner after reaching statistical significance — consistently improving CTR by 20 to 40 percent compared to single-variant publication. That alone justifies the cost for any channel publishing regularly.
How to Diagnose a Video That Underperformed
A 5-Step Audit Framework
When a video underperforms, most creators either repost it or abandon it. Both are wrong. Here’s the diagnostic process I actually use now:
Step 1 — Check CTR by traffic source. Open YouTube Studio → Analytics → Reach. Don’t look at overall CTR. Look at CTR broken out by Browse Features, Suggested Videos, and Search separately. A low Browse CTR is a thumbnail problem. A low Search CTR is a title/intent mismatch problem. Different diagnosis, different fix.
Step 2 — Pull the retention curve. Go to Analytics → Engagement → Audience Retention for the specific video. Find the biggest single drop in the first 30 seconds. That’s your hook problem. Any cliff after the 50% mark is usually a pacing or structure problem.
Step 3 — Check where your impressions came from. A video can underperform because YouTube simply didn’t show it to enough people, not because people rejected it. If impressions are low, the issue is algorithmic distribution (often tied to topic relevance for your channel, or posting timing). If impressions are high but CTR is low, that’s a packaging problem.
Step 4 — Compare against your own channel average. Don’t benchmark against generic industry numbers. According to YouTube’s Creator Academy, the most important comparison is against similar-length videos in your niche — YouTube’s relative audience retention metric shows exactly how you stack up. Open YouTube Studio and use the “See how your video compares” feature in the retention tab.
Step 5 — Identify one change, not five. This is where most creators make the mistake. They fix the thumbnail AND re-edit the opening AND change the title AND update the description all at once. Now you don’t know what worked. Pick your highest-leverage fix from steps 1–4 and change one thing.
For reference, here’s how to pull retention data via the YouTube Analytics API if you want to automate tracking across videos:
# Example: fetch audience retention data for a specific video
# Requires YouTube Analytics API v2 and authenticated credentials

from googleapiclient.discovery import build

youtube_analytics = build('youtubeAnalytics', 'v2', credentials=credentials)

response = youtube_analytics.reports().query(
    ids='channel==MINE',
    startDate='2026-01-01',
    endDate='2026-03-31',
    metrics='audienceWatchRatio',
    dimensions='elapsedVideoTimeRatio',
    filters='video==YOUR_VIDEO_ID'
).execute()

# audienceWatchRatio at each elapsedVideoTimeRatio point = your retention curve
for row in response['rows']:
    print(f"Time: {row[0]:.0%} | Retention: {row[1]:.1%}")
Turning Analysis Into Action: The Fix-and-Retest Loop
Analysis without action is just expensive anxiety. The loop that actually works:
Diagnose → Form one hypothesis → Make one change → Publish → Wait 7–14 days → Compare.
The 7–14 day window is important. New channels and new videos often see a higher CTR in the first few hours because YouTube initially shows the video to the most engaged subscribers. As the video gets pushed to broader audiences, CTR naturally drops — this is completely normal and is not a sign that your video is failing. Don’t judge a thumbnail change after 48 hours.
Keep a running log: what you changed, what you expected, what actually happened. After 10 videos of tracked experiments, you’ll know more about what your specific audience responds to than any general guide can tell you. Channels that actively use analytics data see 2–3× faster growth than those relying on intuition alone.
One thing I added to my workflow recently: if a video’s hook retention is below 55% (meaning more than 45% of viewers leave in the first 30 seconds), I don’t publish the next video until I’ve tested a new opening. That constraint alone has meaningfully changed how I write scripts.
Tools for Competitor Video Analysis
Understanding why your competitors’ videos perform better is underrated. The fastest way to close a content gap isn’t to create more videos — it’s to figure out what’s working for channels already serving your audience.
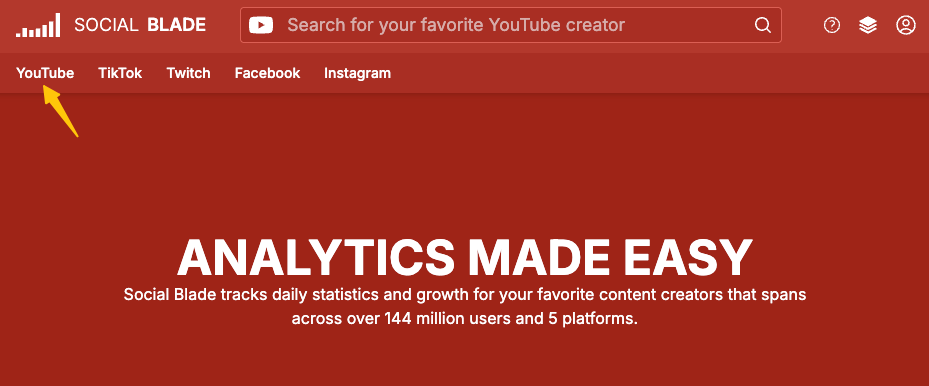
Social Blade is still the most accessible free starting point. It shows public subscriber growth history, upload frequency, and estimated view ranges for any public channel. Good for spotting when a competitor had a breakout period and what they were publishing at that time.
VidIQ’s competitor tracking (Pro tier, ~$16.50/month as of March 2026) lets you benchmark your channel against up to 20 competitors simultaneously — posting frequency, average video length, keyword targeting gaps, and engagement rates. This is where I found out my upload frequency was about 40% of my closest competitors. Not a content quality issue — a volume issue.
OutlierKit takes a different angle: it shows “outlier scores” — how much a specific video outperformed or underperformed a channel’s average. A video scoring 3.5x means it got 3.5 times more views than that channel typically gets. Finding what drives outliers for competitors in your niche is genuinely useful for topic ideation. Their Chrome extension is free.
For retention-specific competitor research, TubeBuddy’s retention heatmaps let you visualize which parts of your own high-performing videos hold attention, then replicate that structure consciously in new content.
FAQ
Q: What’s the single most important YouTube metric to track? A: If I had to pick one, it’s the audience retention percentage at the 30-second mark. If you’re losing most viewers before the 30-second point, nothing else matters — YouTube won’t recommend a video that people immediately leave. Fix the hook first, then optimize everything else.
Q: How often should I check my YouTube Analytics? A: For active creators, once a week is enough for performance data. Daily checking encourages panic-driven decisions based on noise. Reserve deeper dives — where you’re analyzing retention curves and traffic sources for specific videos — for after each video has been live at least 7 days.
Q: Is YouTube Studio enough, or do I need paid tools? A: YouTube Studio is genuinely enough until you have 20+ published videos and want to start A/B testing thumbnails or doing keyword research. Before that, the biggest gains come from improving your content based on native analytics, not from adding more tools.
Q: What’s the difference between Average View Duration and retention rate? A: AVD tells you the average number of minutes watched. Retention rate (or Average Percentage Viewed) tells you what fraction of the total video was watched on average. Retention rate is more useful because it normalizes for video length — letting you compare a 3-minute video against a 15-minute one on equal footing.
Previous Posts: